

Key findings
- Of 192 live US dental ads from 99 advertisers, one dental group ran 73 (38%), almost all of them videos. Without it, 42% of the other 119 ads were single images and 26.9% videos.
- Dental ads ran for a long time: the median ad had been live for 365 days, and 52.6% for over a year.
- 38.8% of English dental ad texts made an offer and 25% put it in the first line; of those with an offer, 77.8% put it in the first 150 characters, the highest share of the five trades. 71.5% used an exclamation mark, also the most of the five.
- Only 19.1% of 47 dental landing pages had a form, and 4.3% showed one on the first screen, while 72.3% showed a phone link there. 12 of the 47 pages came from one implant vendor; without them, 25.7% had a form.
- 29.8% of 47 dental advertisers passed all four of our basics, and 75% of the 28 dental advertisers we looked up also ran Google ads in the last 30 days.
Meta Ad Library, our own page visits and Google Ads Transparency Center · Dentists in five studies: 192 ads from 99 advertisers; 123 distinct ad texts; 47 landing pages; 47 scored advertisers; 28 Google checks · 3 to 12 November 2026 · How we did this · Download the data (CSV)
Facebook ads for dentists look busy in the Meta Ad Library, but much of what you see comes from a few large groups. Over the past two weeks we studied live Facebook and Instagram ads from US local businesses five different ways: the ads, the words in them, the page after the click, a four-point scorecard and a check of who also runs Google ads. This page pulls out what we found about dentists.
The short version: Facebook ads for dentists run for a long time, use exclamation marks more than any other trade, and send people to pages built around the phone. The full figures, with the study each comes from, are free to download at the end.
What Facebook ads for dentists look like
We found 192 live US dental ads from 99 advertisers. One dental group ran 73 of them, 38% of the total, and 97.3% of its ads were videos. That one group makes the whole trade look video-heavy: across all 192 ads, 53.6% were videos. Without it, the other 119 ads from 98 advertisers were 42% single images and 26.9% videos.
79.8% of the dental advertisers had only one ad in our sample. Their ads were old: the median ad had been live for 365 days, 96.4% for 90 days or more and 52.6% for over a year. Taking each advertiser's own median instead, the typical dental advertiser's ads had been live for 492 days.
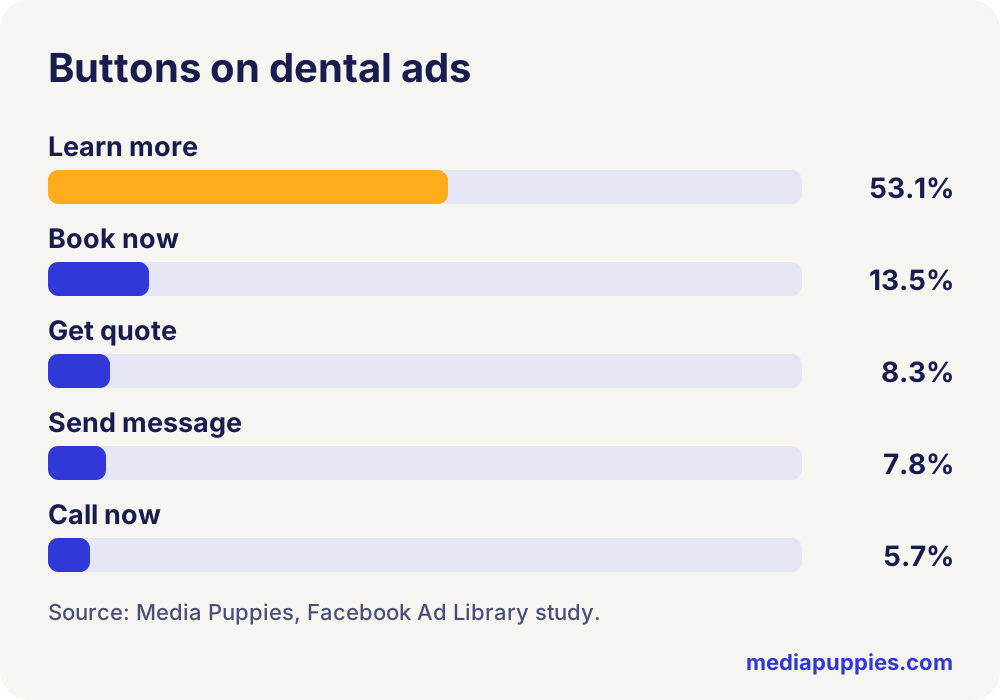
53.1% of the dental ads used a Learn more button. Without the large group, Learn more fell to 24.4% and Book now rose to 21.8%. 78.6% of all the ads linked to a website, 11.5% asked people to call or message, and 4.2% used Meta's instant form.
The large group also shaped the offers. 19 of its 73 ads mentioned financing, so across all dental ads financing appeared in 13%, but among the other 119 ads it was 5%. The other advertisers' ads had a median of 456 days live.
What the ads say
We measured 123 distinct dental ad texts. The median text was 36 words, or 216 characters, and 61.8% ran past 150 characters, the top of the 50 to 150 characters Meta's ads guide suggests for single-image ads.
38.8% of the English dental texts made an offer, such as a free consultation, a new-patient price or financing, and 25% put it in the first line. Of the texts with an offer, 77.8% put it within the first 150 characters, the highest share of the five trades. 50.9% told the reader what to do, and 22% opened with a question. 71.5% of the texts used an exclamation mark, the most of the five trades, and 36.6% an emoji. The median text read at about grade 7 to 8 (Flesch-Kincaid), and 22% wrote a phone number in the text. Only 18.7% named a place or called the practice local, the lowest of the five trades.
In the Ad Library data, 13% of dental ads mentioned financing and 9.9% gave a price, more than law firms did. Only 6.8% offered something free and 4.7% used social proof such as reviews.
Where dental ads appear
Almost every dental ad ran on both Facebook (96.9%) and Instagram (96.9%). 35.4% also ran on Meta's Audience Network, which places ads inside other apps, but the large group used it on only 1 of its 73 ads; the other dentists used it on 56.3%. 17.2% of dental ads used dynamic creative, where Meta mixes several images and texts. Our view is that a practice running one ad for a year should at least test a second version against it.
The page after the click
We opened the most-used link of 47 dental advertisers on an iPhone-sized screen. 38.3% sent clicks to a separate landing page and 38.3% to the home page, and 19.1% to an inner page. 57.4% of the sites ran on WordPress. The median page weighed 2.9 MB and 21.3% were over 5 MB.
One implant vendor made 12 of the 47 pages, and the landing page study reports dentists with and without them. Without the vendor's pages, 51.4% of dental advertisers used the home page and 17.1% a separate landing page, 42.9% of links passed through a redirect, 57.1% of pages loaded the Meta pixel, 45.7% sent a request to Meta, and 11.4% were over 5 MB.
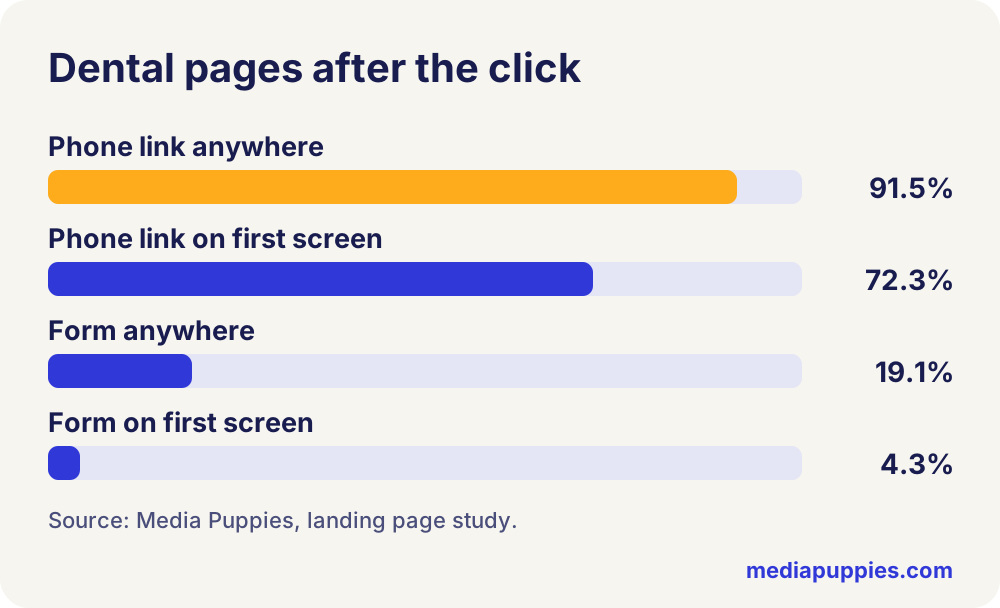
The phone carried the page. 91.5% had a tap-to-call link, 72.3% showed it on the first screen and 61.7% kept it fixed as you scrolled. Forms were rare: only 19.1% of the pages had one, and 4.3% showed it on the first screen. 55.3% of the links passed through at least one redirect before the page loaded.
68.1% of the pages loaded the Meta pixel, but only 57.4% sent a request to Meta during our visit, and 89.4% had a Google tag. Our view is that the gap between the two pixel figures is worth checking: a pixel that loads but does not fire counts nothing.
How dentists score on four basics
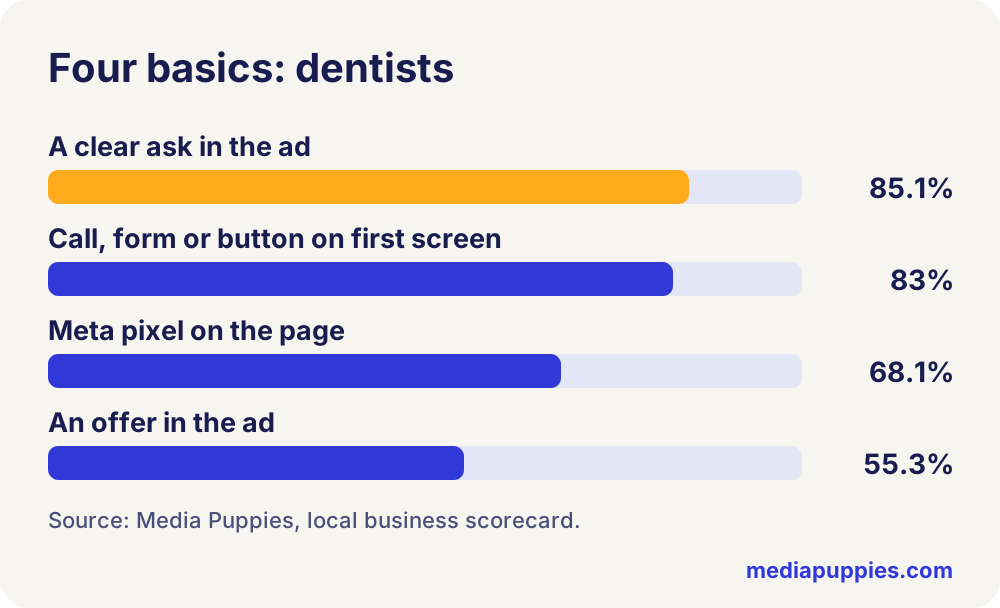
In our local business scorecard we checked 47 dental advertisers on four basics: an offer in the ad, a clear ask in the ad, a way to call or enquire on the first screen of the page, and the Meta pixel. 29.8% passed all four, 14 advertisers. Dentists had the second-strongest asks of the five trades (85.1%, behind med spas) but, as everywhere, the offer was the weak point: 55.3% had one anywhere in the ad text, headline or link description. Of the 18 advertisers that passed three checks, 9 were missing the offer. The average dental advertiser passed 2.91 of the four checks.
Facebook alone or Facebook plus Google
We looked up 28 dental advertisers from the same set in Google's Ads Transparency Center. 75% of them had shown Google ads in the US in the last 30 days, and among those with Google ads, the median was 7 ads in that time and 10 on record overall. The dentists with the Meta pixel on their page were more likely to be on Google too: 14 of 17, against 7 of 11 where our visit saw no pixel. For most dental practices in this sample, Facebook was one of two channels.
What we would change in a dental practice's Facebook ads
- Keep the offer, make it specific. 38.8% of dental texts made an offer. A new-patient price or a free implant consultation in the first line works better than a general welcome, in our view.
- Add a short booking form. Only 4.3% of dental pages showed a form on the first screen. In our view, a form catches patients who decide after hours, when nobody answers the phone.
- Check the pixel fires. 68.1% loaded it, but only 57.4% sent a request to Meta.
- Lighten the page. 21.3% of dental pages were over 5 MB (11.4% without the implant vendor's pages).
- Refresh old ads. The median dental ad had been live for a year. Our view is that one new test a month keeps an account learning.
For the Google side, see our dental PPC guide and our dental marketing data. If you run Facebook or Google ads for a dental practice in the US, UK, Canada or Australia, give us read access to the account. A senior buyer will write a free audit of where the spend goes, whether your tracking counts real results, how your creative is holding up, and the three things we would fix first. It takes about two working days and the document is yours. More studies are on our research page.
How we did this
- Source
- Meta Ad Library, our own page visits and Google Ads Transparency Center
- Country
- United States
- Collected
- 3 to 12 November 2026
- Sample
- Dentists in five studies: 192 ads from 99 advertisers; 123 distinct ad texts; 47 landing pages; 47 scored advertisers; 28 Google checks
- Sources
- Facebook Ad Library study, ad copy study, landing page study, local business scorecard, Google Ads vs Facebook ads study
This page collects nothing new. It takes the dentist figures from five studies we published in November 2026, each with its own method page: our Facebook Ad Library study (192 live US dental ads from 99 advertisers, collected 3 November through keyword searches such as dentist and dental implants), our ad copy study (123 distinct dental ad texts), our landing page study (47 dental pages opened on a phone on 7 November), our local business scorecard (47 advertisers scored on four basics) and our Google Ads vs Facebook ads study (28 advertisers looked up in Google's Ads Transparency Center on 12 November).
One dental group ran 73 of the 192 ads, so wherever a figure would be driven by that one advertiser we also give it without that group. The groups in the five studies overlap but are not identical, because each kept a different subset. Each figure uses the base of the study it comes from, and the dataset lists every figure with its source.
Limits. The advertisers came from keyword searches, so they lean toward implant and cosmetic dentistry, which advertise heavily, and the sample is not every US dental practice on Facebook. "Live for" means days since the ad started. None of the sources show spend or results, so nothing here says which ads worked.
Download the data (CSV). Free to reuse with a link to this page.
Questions about Facebook ads for dentists
Do Facebook ads work for dentists?
Our data shows what dental practices run, not which ads worked. 99 US dental advertisers had live Facebook or Instagram ads in our November 2026 sample, and 75% of the 28 we looked up also ran Google ads.
What should a dental Facebook ad say?
38.8% of English dental ad texts made an offer and 25% put it in the first line. In our view, a specific new-patient offer, a clear ask such as Book now and a short text do the most work.
Should dental Facebook ads use video?
One large dental group ran almost only videos. Without it, 42% of other dental ads were single images and 26.9% videos, so both are common.
Where should a dental Facebook ad send people?
38.3% of dental advertisers used a separate landing page and 38.3% the home page, or 17.1% and 51.4% without one implant vendor's pages. 72.3% showed a phone link on the first screen, but only 4.3% showed a form there.
Can I use this data?
Yes. Download the CSV from this page and reuse it with a link back. It lists every figure with the study it comes from.